Lawrence Martin, M.D., FACP, FCCP
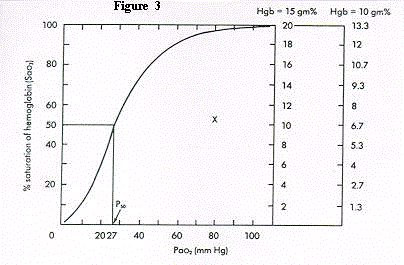
Figure 3. PaO2 vs. SaO2 and oxygen content. The oxygen dissociation curve
relates PaO2 to SaO2. The shape and position of the curve are the same regardless
of hemoglobin content. The right ordinates show arterial oxygen contents for two
different concentrations of hemoglobin: 15 gm% and 10 gm%. Normal P50 (the
PaO2 at which hemoglobin is 50% saturated with oxygen) is approximately 27 mm
Hg. "X" represents measured PaO2 and oxygen saturation of Case 4.

Table of Contents --
References --
Quiz --
Subject Index to all web sites
Forward any comments to:
larry.martin@roadrunner.com
Copyright © 1996-2009 Lawrence Martin, M.D.

