Lawrence Martin, M.D., FACP, FCCP
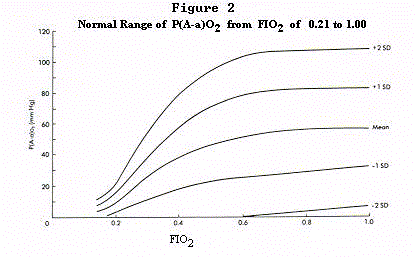
Figure 2. Normal range of P(A-a)O2 from FIO2 of .21 to 1.00,
based on data from 16 healthy subjects aged 40 to 50 years.23 Lines represent mean
values and + or - 2 standard deviations. The P(A-a)O2 increases
up to an FIO2 of 0.6, then plateaus with further increases in FIO2.
Note that P(A-a)O2 may normally exceed 100 mm Hg on an FIO2 of 1.00.
(Reproduced from Reference 1, with permission).

Table of Contents --
References --
Quiz --
Subject Index to all web sites
Forward any comments to:
larry.martin@roadrunner.com
Copyright © 1996-2009 Lawrence Martin, M.D.

